


The Role of Excess Capital in the 2000s Housing Bubble in Ireland: Part One
- brucegs54
- Jul 17, 2024
- 14 min read
In my recent book, Credit Crises: The Role of Excess Capital (Stevenson, 2024), I demonstrate that credit crises are a major force influencing the global economy and commercial banking industry. In particular, I show how these catastrophes are a direct, though lagged, consequence of excess capital – debt that grows more rapidly than economic growth – that flows to subprime and non-investment grade borrowers. The high default probabilities of such borrows emerge as concentrated periods of defaults on loans and / or bonds that cause extreme losses to lenders and, often, significant economic recessions.
The most recent example is the subprime mortgage crisis of 2007 to 2010, that produced the Financial Crisis of the same era. U.S. household net worth declined by nearly $11 trillion from its 3Q2007 peak, a fall of 16 percent.[1] U.S. housing prices fell almost 30 percent, on average, and the U.S. stock market dropped more than 50 percent by early 2009.[2] Simon Johnson of Bloomberg estimated that the lost output and income from the crisis was “at least 40 percent of 2007 gross domestic product.”[3]
The impact of the subprime mortgage crisis on the U.S. banking system was profound. Bank failures jumped dramatically in 2008, reaching 25 total failures for the year, up from 3 in 2007 and peaked at 157 failed banks in 2010 (Stevenson, 2024). Further, the impact of the crisis on bank failures was longer lasting than its impact on the crisis on the U.S. economy. Bank failures related to the crisis continued through 2015, even though the economy had been in recovery and growing for several years. In fact, from 2007 through 2015, the number of failed banks totaled 518, or 7.1 percent of the active banks in 2007. Because the largest banks in the U.S. received capital infusions from the U.S. government via the Troubled Asset Relief Program, very few large banks failed, and the assets of failed banks totaled $707 billion from 2007 to 2015, representing only 0.01 percent of the banking industry’s assets in 2007.
The subprime mortgage crisis of the 2000s was not the first one in real estate, as other notable catastrophes include the real estate crisis in Japan in the late 1980s and the collapse of commercial real estate in the United States between 1989 and 1992. The cyclical nature of real estate expansion leading to speculation and eventual collapse has dominated the banking industry in developed countries in the 20th and 21st centuries.
Moreover, the credit crisis in the mortgage markets was not restricted to the United States. Mortgage markets collapsed throughout the developed world, especially in Spain and Ireland, after experiencing dramatic growth in the early- and mid-2000s.
This blog examines the dynamics of Irish loan markets in the 2000s and 2010s in the context of the Excess Capital Hypothesis (ECH), a concept that I present Credit Crises. In Part One of the blog, I show that the expansion and contraction of debt in Ireland, relative to the growth of the Irish economy, explains most, if not all, of the housing crisis that occurred in Ireland in the 2000s, as well as the severe economic contraction in Ireland at this time. In Part Two, I examine how the predictions of the ECH fit to the credit and banking crisis in Ireland during this period.
The Credit Crisis of the Late 2000s in Ireland
Ireland’s largest economic recession began in 2008 when the national Gross Domestic Product (GDP) contracted for the first time for the first time since 1995 (real GDP shrank by 10.3% in 2008; Figure 1). The country remained in recession in 2009: for the full year 2009, GDP shrank by 3.7 percent. Although GDP grew in 2010 (0.1 percent) and 2011 (0.7 percent), it shrank again in 2012 (-2.1 percent).

Figure 1. Real Domestic Product in Ireland, 1Q1995 to 3Q2023.
(Source: Federal Reserve Bank of St. Louis.)
Before this dramatic economic contraction, massive growth in real estate prices formed a classic asset bubble (Figure 2). From 1Q1970 to 2Q1996, housing prices grew linearly, but from 3Q1996 though 2Q2007, they more than quadrupled. From this point, prices crashed (-54.5%), reaching a bottom in the first quarter of 2013. For the purposes of this article, the Irish housing bubble began in 3Q1996 and ended in 1Q2013.
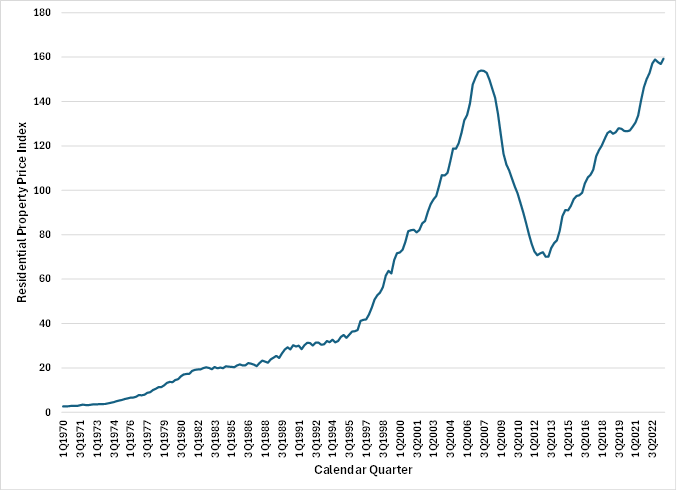
Figure 2. Residential Property Price Index in Ireland, 1Q1970 to 3Q2023 (2010 = 100).
(Source: Federal Reserve Bank of St. Louis.)
In the expansion phase of this bubble, home price inflation was three to seven times greater than inflation in other sectors of the Irish economy (Drudy & Collins, 2011).
An equally dramatic growth in domestic debt[4] occurred at the same time in Ireland, particularly in relation to GDP (Figure 3). Domestic loans scaled to GDP grew steadily from 1960 to 1994. From 1994 through 2009, this measure of debt to GDP (“debt to GDP” or “debt / GDP”) nearly quadrupled (43.4 percent in 1994 and 169.3 percent in 2009, a 3.9x increase).
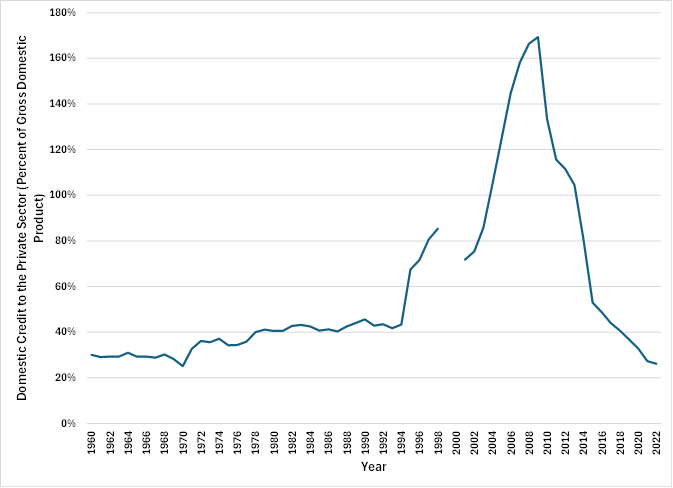
Figure 3. Domestic Credit Divided by Gross Domestic Product in Ireland, 1960 to 2022.
(Source: World Bank. Note: data for 1999 and 2000 are not available.)
Note that the temporal pattern of credit to GDP in Figure 3 is very similar to the pattern of housing prices in the same period of time, as shown in Figure 2. We will investigate this relationship shortly.
The Irish banking system suffered greatly in the collapse of the housing sector. A significant contributor to the stress on Irish banks were large-scale defaults of loans to property developers (Whelan, 2010). Kelly (2007) also noted that the heavy reliance of the Irish economy on its housing sector and the collapse of housing prices created the huge recession I noted previously.
Losses to Irish banks became so large that intervention by the Irish government became necessary. In September 2008, the government provided a blanket guarantee to the banks and large property loans were transferred to a government-backed asset management company. Dellepiane et al. (2013) estimated that the amount of public funding the Irish government put into the banking system approached 65 billion euros or 45% of Ireland’s gross domestic product.
However, these moves were inadequate and, by late 2010, the capital markets began to shun Irish government debt and yields on that debt increased significantly, implying that the government lacked the resources to manage the crisis. A run on Irish banks prompted the Irish government to agree to a financial support program from the International Monetary Fund (IMF). The IMF also supported liquidity needs of the Irish banks.
In 2011, two Irish banks were liquidated and the others were re-capitalized, with equity holders essentially wiped out. Holders of subordinated debt issued by these banks also suffered losses.
What Caused the Bubble in Irish Housing Prices?
Given the extreme losses suffered when the bubble burst, it is important to understand the causes of the bubble. Unsurprisingly, Irish housing prices have been the subject of academic research and investigation by bankers and regulators.
A principal factor driving this bubble appears to be the shift in the Irish economy toward housing construction fueled by easy availability of debt capital and credit-induced demand for housing.
At the start of the 1990s, Ireland was a relatively poor country by Western European standards, with high poverty, high unemployment, inflation, and low economic growth. However, the Irish economy expanded at an average rate of 9.4% between 1995 and 2000, giving rise to the title “Celtic Tiger"[5] The causes of this growth included low corporate tax rates, investment in high-tech industrial projects by foreign corporations and capital injections by the European Union (Whelan, 2010).[6]
A significant shift in the Irish economy began in the late 1990s and early 2000s when housing and, in particular, construction of housing became more important to economic growth (Kelly, 2009, 2010; Drudy & Collins, 2011). According to Whelan (2010), the low stock of usable houses in Ireland in the 1990s suddenly gave rise to a construction boom in the 2000s (also see Baudino et al, 2020). This boom was facilitated by low interest rates in Europe and across the globe.
Rapid Growth in the Number of Houses. In 2000, there were 1.25 million households in Ireland. From 2000 to 2008, more than 0.6 million new homes were completed, representing nearly one-half of the households present in 2000 (48.8 percent; see Whelan, 2010; Quinn and Turner, 2020. The number of Irish households grew to 1.67 million in 2010, implying that Ireland’s households absorbed some, but not all, of the newly completed homes. Kitchen et al. (2015) noted that, from 2002 to 2006, more housing units were being built than households being formed in Ireland.
By comparison, new housing completions in the U.S. between 2000 and 2008 totaled 14.8 million which was 14.1 percent of the 105.5 million households in the U.S in 2000. The number of U.S. households totaled 116.7 million in 2010, implying that a greater percentage of the newly constructed homes in the U.S. were occupied.
In Canada, new housing completions totaled 1.75 million between 2000 and 2008, representing 11.9 percent of the 14.7 million households in 2000.
This heavy emphasis on real estate construction created two unusual results in Ireland. The first was a significant shift in employment to the construction sector, causing a reduction in the persistently high unemployment in Ireland. In 2007, construction accounted for 13.3 percent of all employment, the highest share in the OECD by almost five percentage points (Wheelan, 2010). Of course, this concentration made the Irish economy vulnerable to a slowdown in housing and property development (Kelly, 2007).
The explosion of new homes in Ireland also exacerbated a pre-existing situation: unoccupied homes. According to the Central Statistics Office in Ireland, the number of vacant dwellings doubled from 2002 to 2011 (143,418 to 289,451)[7].
Building new homes should have contributed to a decline in the price of homes in Ireland in the 2000s, particularly since the number of unoccupied homes increased so dramatically. Yet, prices exploded as seen in the financial bubble shown in Figure 2.
Rapid Growth in Credit. I believe that the driver of changes in home prices in Ireland during the 1990s, 2000s and 2010s was the waxing and waning of credit in the Irish economy. As shown in Figure 4, domestic credit divided by GDP (also see Figure 3) is strongly correlated with the index of home prices in Ireland[8], especially during the 2000s. Growth in domestic credit (including financing for residential real estate) began to outpace economic growth in Ireland in 1995 and continued to exceed GDP growth through 2009. Growth in the Irish home price index began to accelerate in 1996 and continued through 2007, creating the growth phase of this financial bubble.

Figure 4. Domestic Credit Divided by Gross Domestic Product in Ireland Compared to Residential Property Price Index, 1990 to 2022.
(Sources: World Bank and Federal Reserve Bank of St. Louis. Note: data on Domestic Credit / GDP are not available for 1999 and 2000.)
According to Storey (2011), a huge increase in household debt in Ireland, which is a subset of domestic credit, was the primary fuel for the property price bubble[9]. From 2003 to 2008, household debt nearly tripled, rising from €57 billion to €157 billion. The majority of this household debt was residential mortgages, which also tripled from 2003 (€44 billion) to 2008 (€128 billion) (also see Baudino et al., 2020). Kelly (2009) also argued that credit expansion in Ireland in the 2000s caused property values to rise and subsequent contraction in credit caused them to fall.
Irish banks themselves borrowed heavily in order to lend to their customers: the 6 main Irish banks borrowed €15 billion from abroad in 2003 but this figure had risen to €100 billion by 2007. This borrowing left these banks highly leveraged when property prices began to fall.
What were the drivers of this explosion in residential real estate debt? A primary factor was a dramatic relaxation of underwriting standards.
The Central Bank of Ireland participates in the quarterly survey on lending and underwriting practices conducted by the European Central Bank with all national banks in the euro area. This Bank Lending Survey seeks to obtain information on lending conditions and the changes in banks’ supplies of loans.
Figure 5 presents the survey results on credit standards among Irish banks as reported for the period 4Q2002 to 4Q2023. Panel A of Figure 5 shows the tightening (positive values for the diffusion index) and loosening (negative values) of credit standards on loans made by Irish banks for purchase of a house. Panel B shows banks’ loosening and tightening of credit standards on loans to enterprises.
A striking cyclical pattern appears in these self-reported results in which credit standards on house purchase loans were loosened from late 2002 to the third quarter of 2007, and especially in 2004 (Figure 5 Panel A). In late 2007, there was dramatic tightening of those standards that persisted through 2008, with somewhat lower tightening through mid-2012.

Figure 5 Panel A. Changes in Credit Standards for Approvals of Loans to Purchase Houses Made by Irish Banks, 4Q2002 to 4Q2023
(Source: European Central Bank.)
The temporal pattern of underwriting standards on loans to enterprises is broadly similar: easing in 2003 and 2004 and dramatic tightening from 2Q2007 to 2Q2010 (Figure 4 Panel B).

Figure 5 Panel B. Changes in Credit Standards for Approvals for Loans to Enterprises Made by Irish Banks, 4Q2002 to 4Q2023
(Source: European Central Bank.)
A number of other researchers have highlighted the role of relaxed underwriting standards by Irish banks in the mid-2000s (Kelly, 2010; Drudy & Collins, 2011; Norris & Coates, 2011; Lyons & Muelbauer, 2013; Baudino et al., 2020; Quinn & Turner, 2020;). One example of these loosened standards was mortgages that had increasingly larger loan-to-value (LTV) ratios. For example, Irish banks introduced mortgages with 100 percent LTV in 2004 and, by 2008, such loans made up 12 percent of all new mortgages (Norris & Coates, 2011).
Lyons and Muelbauer (2013) examined the importance of credit conditions on during the inflation and deflation in Irish housing prices. For these researchers, the ratio of mortgage credit to aggregate at individual Irish banks was a proxy for the banks’ willingness to loosen or tighten underwriting standards on mortgage loans. When the ratio increased, mortgage portfolios (assets on a bank’s balance sheet) grew faster than deposits (a liability); when the ratio declined, the loan portfolios were shrinking relative to deposits. They assert that increases in this ratio resulted from loosened underwriting standards for mortgages and decreases in the ratio from tightened standards.
Lyons and Muelbauer (2013) discovered that almost all of the price increases in Irish homes during the expansion of the bubble (2001 to 2007) could be attributed to two measures of credit conditions: (1) the mortgage credit to deposits ratio which was growing and (2) loan-to-value ratios for first-time home buyers which was also increasing.
In this “go-go” period, Irish banks also introduced new, increasingly risky types of residential property loans, including interest-only mortgages in which borrowers paid only interest in their regular payments, leaving repayment of borrowed principal to the very end of the loan’s life (Norris & Coates, 2011). In addition, “buy-to-let” transactions, in which an investor took out a mortgage to purchase a rental property, became common.
During this time, Irish banks focused on growth and market share, and this growth was facilitated by the inflow of cheap capital from overseas markets (Baudino et al., 2020). These banks lent heavily to property developers and to individuals for home purchases (e.g., mortgages).
Relaxation of underwriting standards and introduction of risky types of loans in Ireland mirrored similar behavior of U.S. banks in the heyday of subprime mortgage lending in the mid-2000s. As I document in Credit Crises, loosened underwriting standards by U.S. banks permitted subprime borrowers to obtain mortgages at this time, even though there was clear evidence that, historically, subprime borrowers default at rates that were many multiples of the default rates of prime borrowers.[10] The credit risk of those subprime borrowers became evident when default and foreclosure rates exploded from 2007 to 2009 (the subprime mortgage crisis).
The loosening of credit standards and the introduction of new loan products by Irish banks allowed them to lend to customers who did not previously have access to residential mortgages (Baudino et al., 2020). In particular, interest only mortgages and mortgages with 100 percent LTV brought “marginal” retail borrowers into the market (O’Sullivan & Kennedy, 2010; Baudino et al., 2020). Loan approvals by Irish banks grew geometrically from 2002 to 2006, and then collapsed in 2007 and 2008 (O’Sullivan & Kennedy, 2010).
What caused the bubble in Irish housing prices to pop? It appears that increasing delinquencies on these loans was an important trigger.
In Figure 6, I plot Ireland's residential property price index with the ratio of doubtful loans to gross loans from 2000 to 2022. There is a clear negative association between the incidence of doubtful loans and the price index. When doubtful loans were low in the early- and mid-2000s and credit was extended liberally to borrowers, the demand induced by this excess capital drove home prices higher to a maximum in 2007 (also see Figure 3).
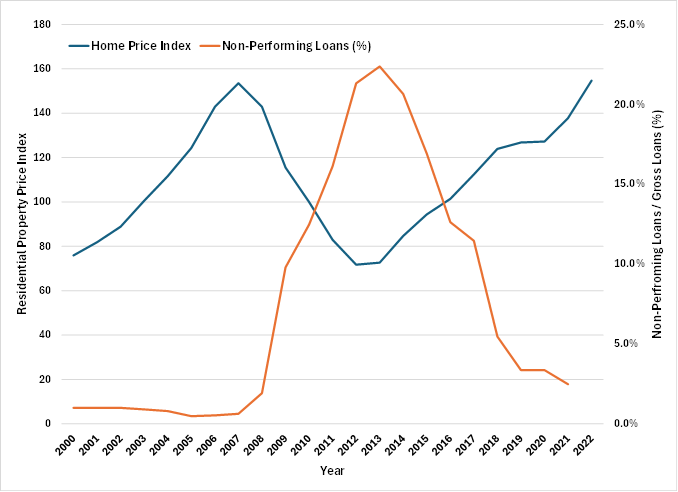
Figure 6. Home Price Index Compared to the Incidence of Non-Performing Loans Among Total Loans for Ireland, 2000 to 2022.
(Sources: Federal Reserve Bank of St. Louis and World Bank)
When non-performing loans started to increase as a percentage of total loans between 2007 and 2008, property prices began to fall (Figure 6). This decline continued through 2012 when home prices began to increase again. The incidence of non-performing declined, and the home price index increased, through 2021. From 2008 to 2021, the correlation between these two variables was almost perfectly negative.[11].
Many of the doubtful loans that triggered the contraction in home prices were the loans to property developers that led to the strong concentration of Irish GDP in construction in the 2000s. GDP began to collapse with the onset of delinquencies and defaults on these loans.
Figure 5 Panel A shows that Irish bankers began tightening underwriting standards on loans to purchase homes in 2007 and 2008, precisely when delinquencies began to increase. The increase in delinquencies likely caused this increase in risk aversion. Tightened underwriting standards persisted through 2010 (Figure 5 Panel A).
Stevenson (2024) demonstrated that, for U.S. banks, increasing delinquencies and charge-offs on loans signal bankers to tighten underwriting standards, which has the effect of withdrawing capital from the market. Demand, induced by the excess capital that results from loose underwriting standards, shrinks and asset prices, including home prices, contract.
As happened in the subprime mortgage crisis in the U.S., the tightening by Irish banks likely caused credit to be withdrawn from the mortgage and property development markets in Ireland. The demand for housing, strongly induced by the excess capital released through relaxed underwriting standards, likely was reduced when those standards were tightened. House prices fell accordingly.
Conclusions
House prices in Ireland from 1996 to 2013 are a classic example of a financial bubble fueled by easy credit. I have shown a strong correlation between the rapid inflation of house prices in the early- and mid-2000s and the ratio of domestic debt to GDP. Debt to GDP expanded when Irish bankers relaxed standards for underwriting loans and introduced risky types of loans. These changes allowed new, marginal borrowers to enter the market, increasing aggregate demand for homes. Prices rose as a rose as a result.
When non-performing began to rise as a percent of total loans in 2007 and 2008, lenders tightened loan underwriting standards. The credit-fueled demand for homes shrank as a result. Home prices fell.
References
Baudino, P., Murphy, D. & Svoronos, J.-P. (2020). The banking crisis in Ireland. Bank for International Settlements, FSI Crisis Management Series No. 2
Dellepiane, S., Hardiman, N. & Las Haras, J. (2013). Building on easy money: the political economy of housing bubbles in Ireland and Spain. UCD Geary Institute Discussion Paper Series, WP2013/18
Drudy, P. J. & Collins, M. L. (2011). Ireland: From boon to austerity. Cambridge Journal of Regions, Economy and Society, 1-16. doi:10.1093/cjres/rsr021
Kelly, M. (2007). On the likely extent of falls in Irish house prices. Quarterly Economic Commentary, Summer, 42-54.
Kelly, M. (2009). The Irish credit bubble. University College Dublin, School of Economics Centre for Economic Research Working Paper Series WP09/32. 27 pp. https://www.ucd.ie/t4cms/wp09.32.pdf
Kelly, M. (2010). Whatever happened to Ireland? Centre for Economic Policy Research Discussion Paper No 7811.
Kitchen, R., Hearne, R. & O’Callaghan, C. (2015). Housing in Ireland: From crisis to crisis. National University of Ireland Maynooth, National Institute for Regional and Spatial Analysis. NIRSA Working Paper Series No. 77.
Norris, M. & Coates, D. (2011). Mortgage availability, qualifications and risks in Ireland, 2000-2009. Journal of Current Issues in Finance, Business and Economics 4 (3): 191-206.
Lyons, R. C. & Muelbauer, J. (2013). Explaining the bubble: House prices, user-cost and credit conditions in Ireland, 1975-2012.
O'Sullivan, K.P.V. & Kennedy, T. (2010), "What caused the Irish banking crisis?", Journal of Financial Regulation and Compliance, Vol. 18 No. 3, pp. 224-242. https://doi.org/10.1108/13581981011060808
Quinn, W. and Turner, J. D. (2020). Boom and Bust: A Global History of Financial Bubbles. Cambridge University Press, Cambridge, UK. 288 pp.
Stevenson, B. G. (2024). Credit crises: The Role of Excess Capital. Gatekeeper Press, Tampa, Florida. 460 pp.
Whelan, K. (2010). Policy lessons from Ireland’s latest depression. The Economic and Social Review 41(2): 225-254.
End Notes
[1] Source: St. Louis Federal Reserve. fred.stlouisfed.org/series/BOGZ1FL192090005Q. Last accessed 13 July 2024.
[2] Source: Yahoo Finance. finance.yahoo.com/quote/%5EGSPC/history?period1=-1325635200&period2=1693267200&interval=1mo&filter=history&frequency=1mo&includeAdjustedClose=true. Last accessed 14 July 2024.
[3] www.bloomberg.com/view/articles/2013-09-26/three-unlearned-lessons-from-the-financial-crisis#xj4y7vzkg . Last accessed 14 July 2024.
[4] Domestic or internal debt is debt incurred within a country and typically owed to lenders within the country.
[5] “Celtic Tiger” refers to the similarity of Ireland’s economic growth to that of the “East Asian Tigers” (Hong Kong, Singapore, South Korea, and Taiwan) which experienced rapid growth between the early 1960s and late 1990s. Kitchen et al. (2015) have a more expansive designation for the Celtic Tiger period: 1993 to 2006.
[6] www.nlcs.org.uk/news/nlcs-thinking/what-was-the-cause-of-irelands-rapid-economic-growth. Last accessed 9 July 2024.
[7] www.cso.ie/en/releasesandpublications/ep/p-cp1hii/cp1hii/vac/. Last accessed 9 July 2024.
[8] Over the period 1990 to 2015, the instantaneous Pearson correlation between the residential property index and domestic credit / GDP is 0.860.
[9] Andy Storey, “Ireland’s Debt Crisis Roots and Reactions”, November 2011. https://www.cadtm.org/Ireland-s-Debt-Crisis-Roots-and. Last accessed 18 June 2024.
[10] Delinquency and default rates on consumer loans, including mortgages, increase geometrically by declining credit score. Prime borrowers, whose credit scores typically are 660 or above, have default rates of 0.5 percent per year or less. Subprime customers, whose credit scores are less than 620, have default rates exceeding 5.0 percent per year and sometimes reaching 25.0 percent per year.
[11] Between 2000 and 2021, the instantaneous Pearson correlation of the Irish home price index and the ratio of doubtful loans to gross loans is -0.590. For the period 2007 to 2021, this correlation is -0.974.


Comments